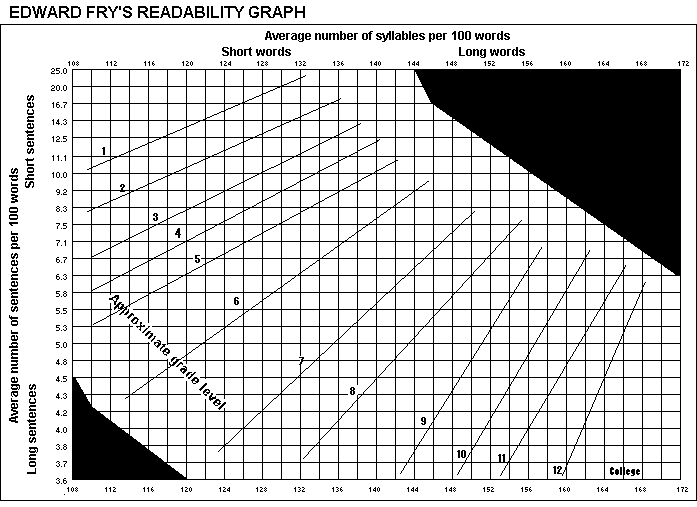
How to use the Readability Graph. Randomly select
three
100-word
passages from a book or an article.
Additional Directions for Working Readability Graph Count the number of sentences in the hundred words, estimating length of the fraction of the last sentence to the nearest 1/10th. Count the total number of syllables in the 100-word passage. If you don't have a hand counter available, an easy way is to simply put a mark above every syllable over one in each word, then, when you get to the end of the passage, count the number of marks and add 100. Enter graph with average sentence length and number of syllables; plot dot where the two lines intersect. Area where dot is plotted will give you the approximate grade level. If a great deal of variability is found, putting more sample counts into the average is desirable. |
